


In this article, we are going to explore how to build interactive and data-driven web apps using Python's library, Streamlit. We will build a few apps to showcase this functionality.
Streamlit is an open-source Python library that makes it easy to create and share beautiful, custom web apps for machine learning and data science. In just a few minutes, you can build and deploy powerful data apps.
Installation
Prerequisites for installing Streamlit include your favorite IDE, a Python installation, and PIP.
To install Streamlit, use this command on your terminal : pip install streamlit.
To check whether your installation was successful, you can run the command : streamlit hello.
We recommend creating and running your projects in a virtual environment, regardless of the package management tool you are using. This prevents the dependencies of one project from impacting those of another.
For full installation instructions on different operating systems, visit (docs.streamlit.io/library/get-started/insta..).
To use Streamlit and its full functionalities in our Python code, we import it with the command : import streamlit as st.
App 1 : Simple Stock Price App
To get the code used for this application, visit (github.com/dataprofessor/streamlit_freecode..).
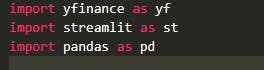
This application visualizes the stock price data for a particular company over a certain period. To access stock data, we use the yfinance(Yahoo finance) API. To use yfinance in our code, we import it with the command: import yfinance as yf.
First, we create a Python file in our virtual environment. Then, we import all the necessary libraries as shown below :
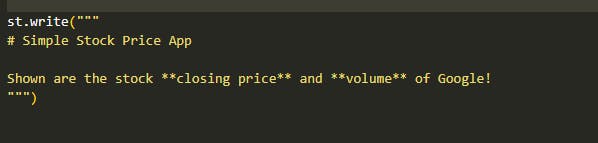
Next, we can give a title to our graphs or subtitles. For instance,
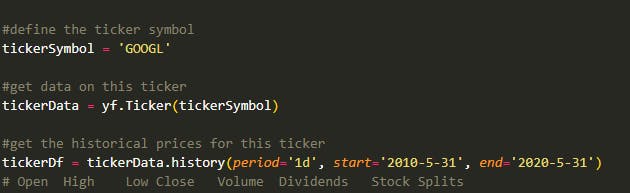
We then define the variable we will use and how to extract historical data for the defined variable.
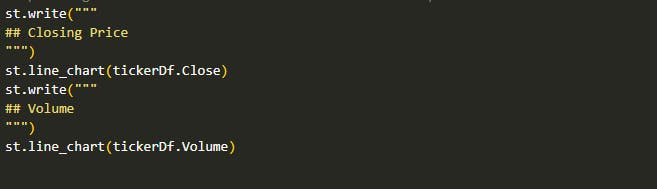
Finally, we specify the type of graph we will be plotting. We can also label the graphs as needed.
We can then view the result by using the command : streamlit run myapp.py.
This and upcoming blogposts are courtesy of #rollademy and their mentorship program. A big shoutout to the team!!